Evidence & Results
Project Outcomes
Measurable results that demonstrate the project's success in building executive-level AI organizational readiness.
of executive leaders were satisfied or extremely satisfied with the session
91% would recommend it to other districts
N = 12
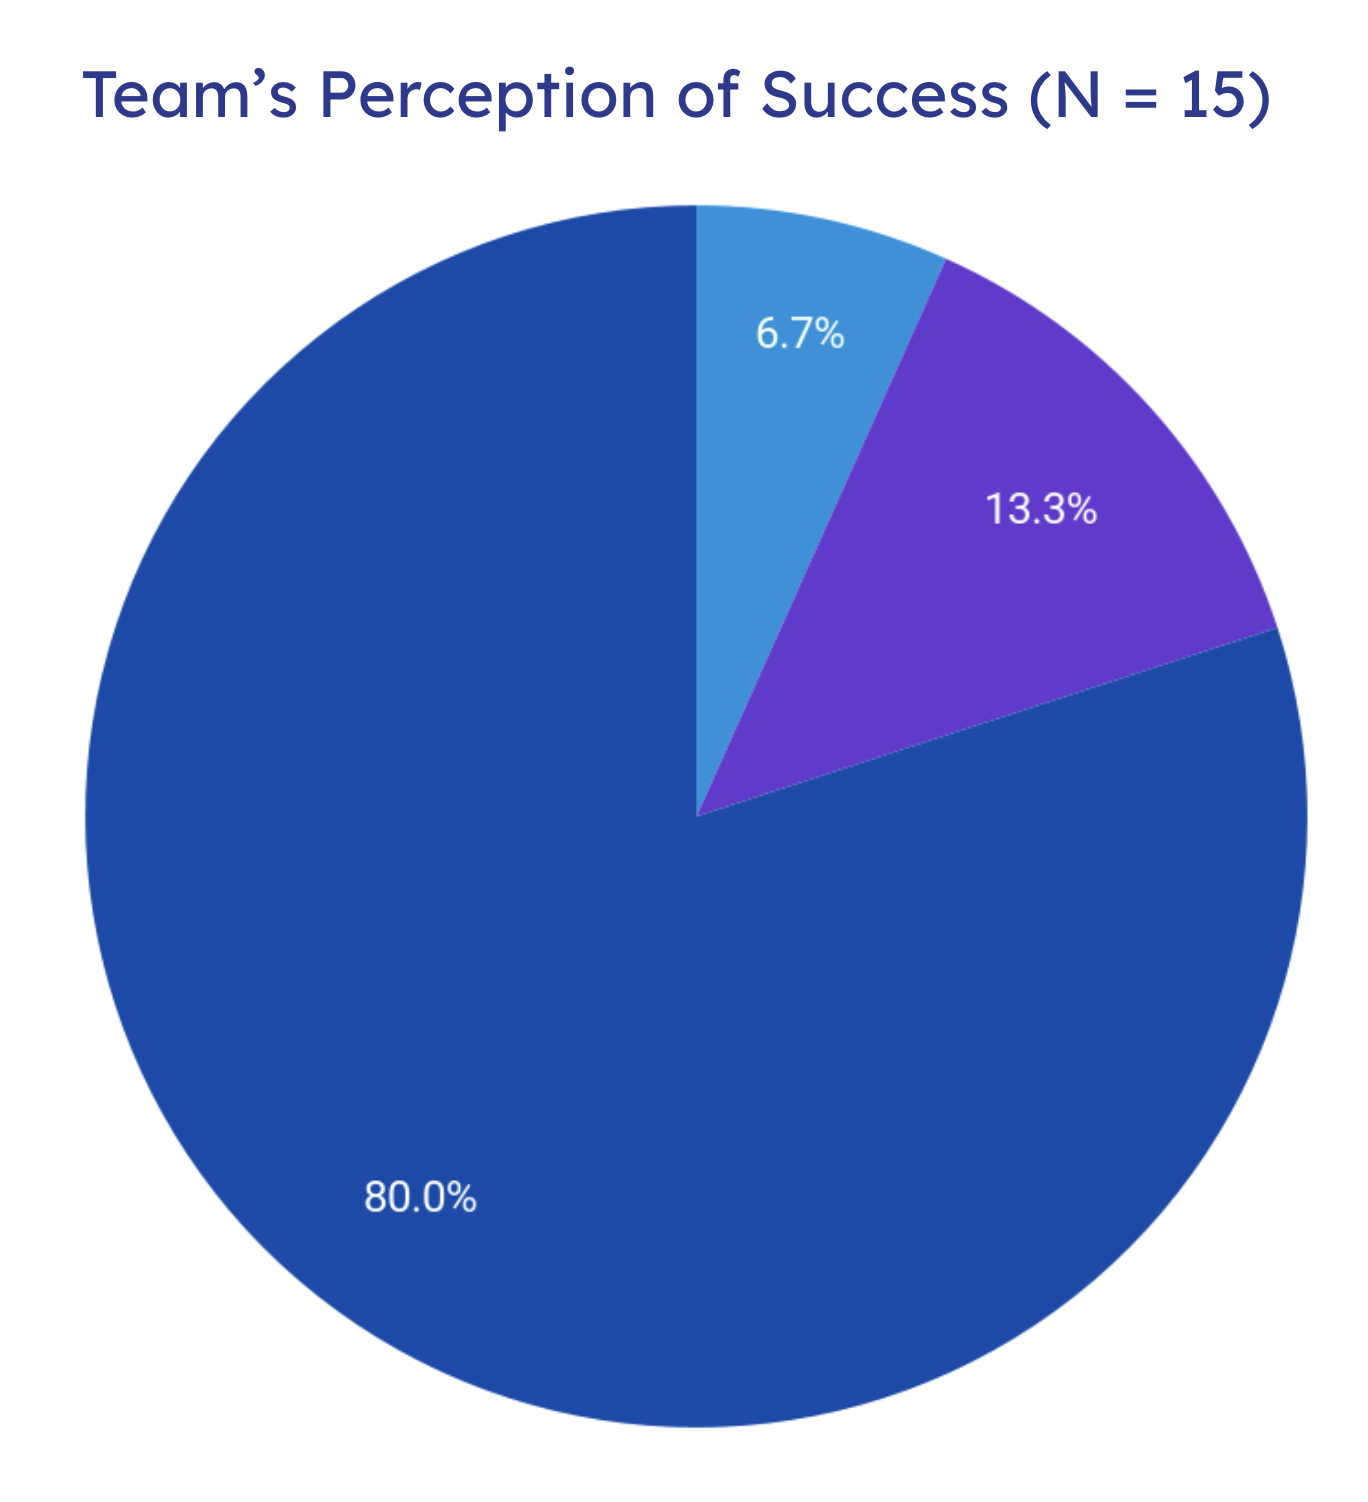
of implementation team regarded the Project as a success
Internal team survey conducted post-delivery
N = 15
additional districts exploring bringing this program to their contexts
3 presentations repurposing session content
Team Perception of Success
Despite the compressed timeline, 80% of team members who completed the survey described the project as a success.
This internal assessment reflects the effectiveness of the adaptive leadership approach employed throughout the project, including deep listening, fostering positive relationships, and maintaining clear communication during the rapid sprint.
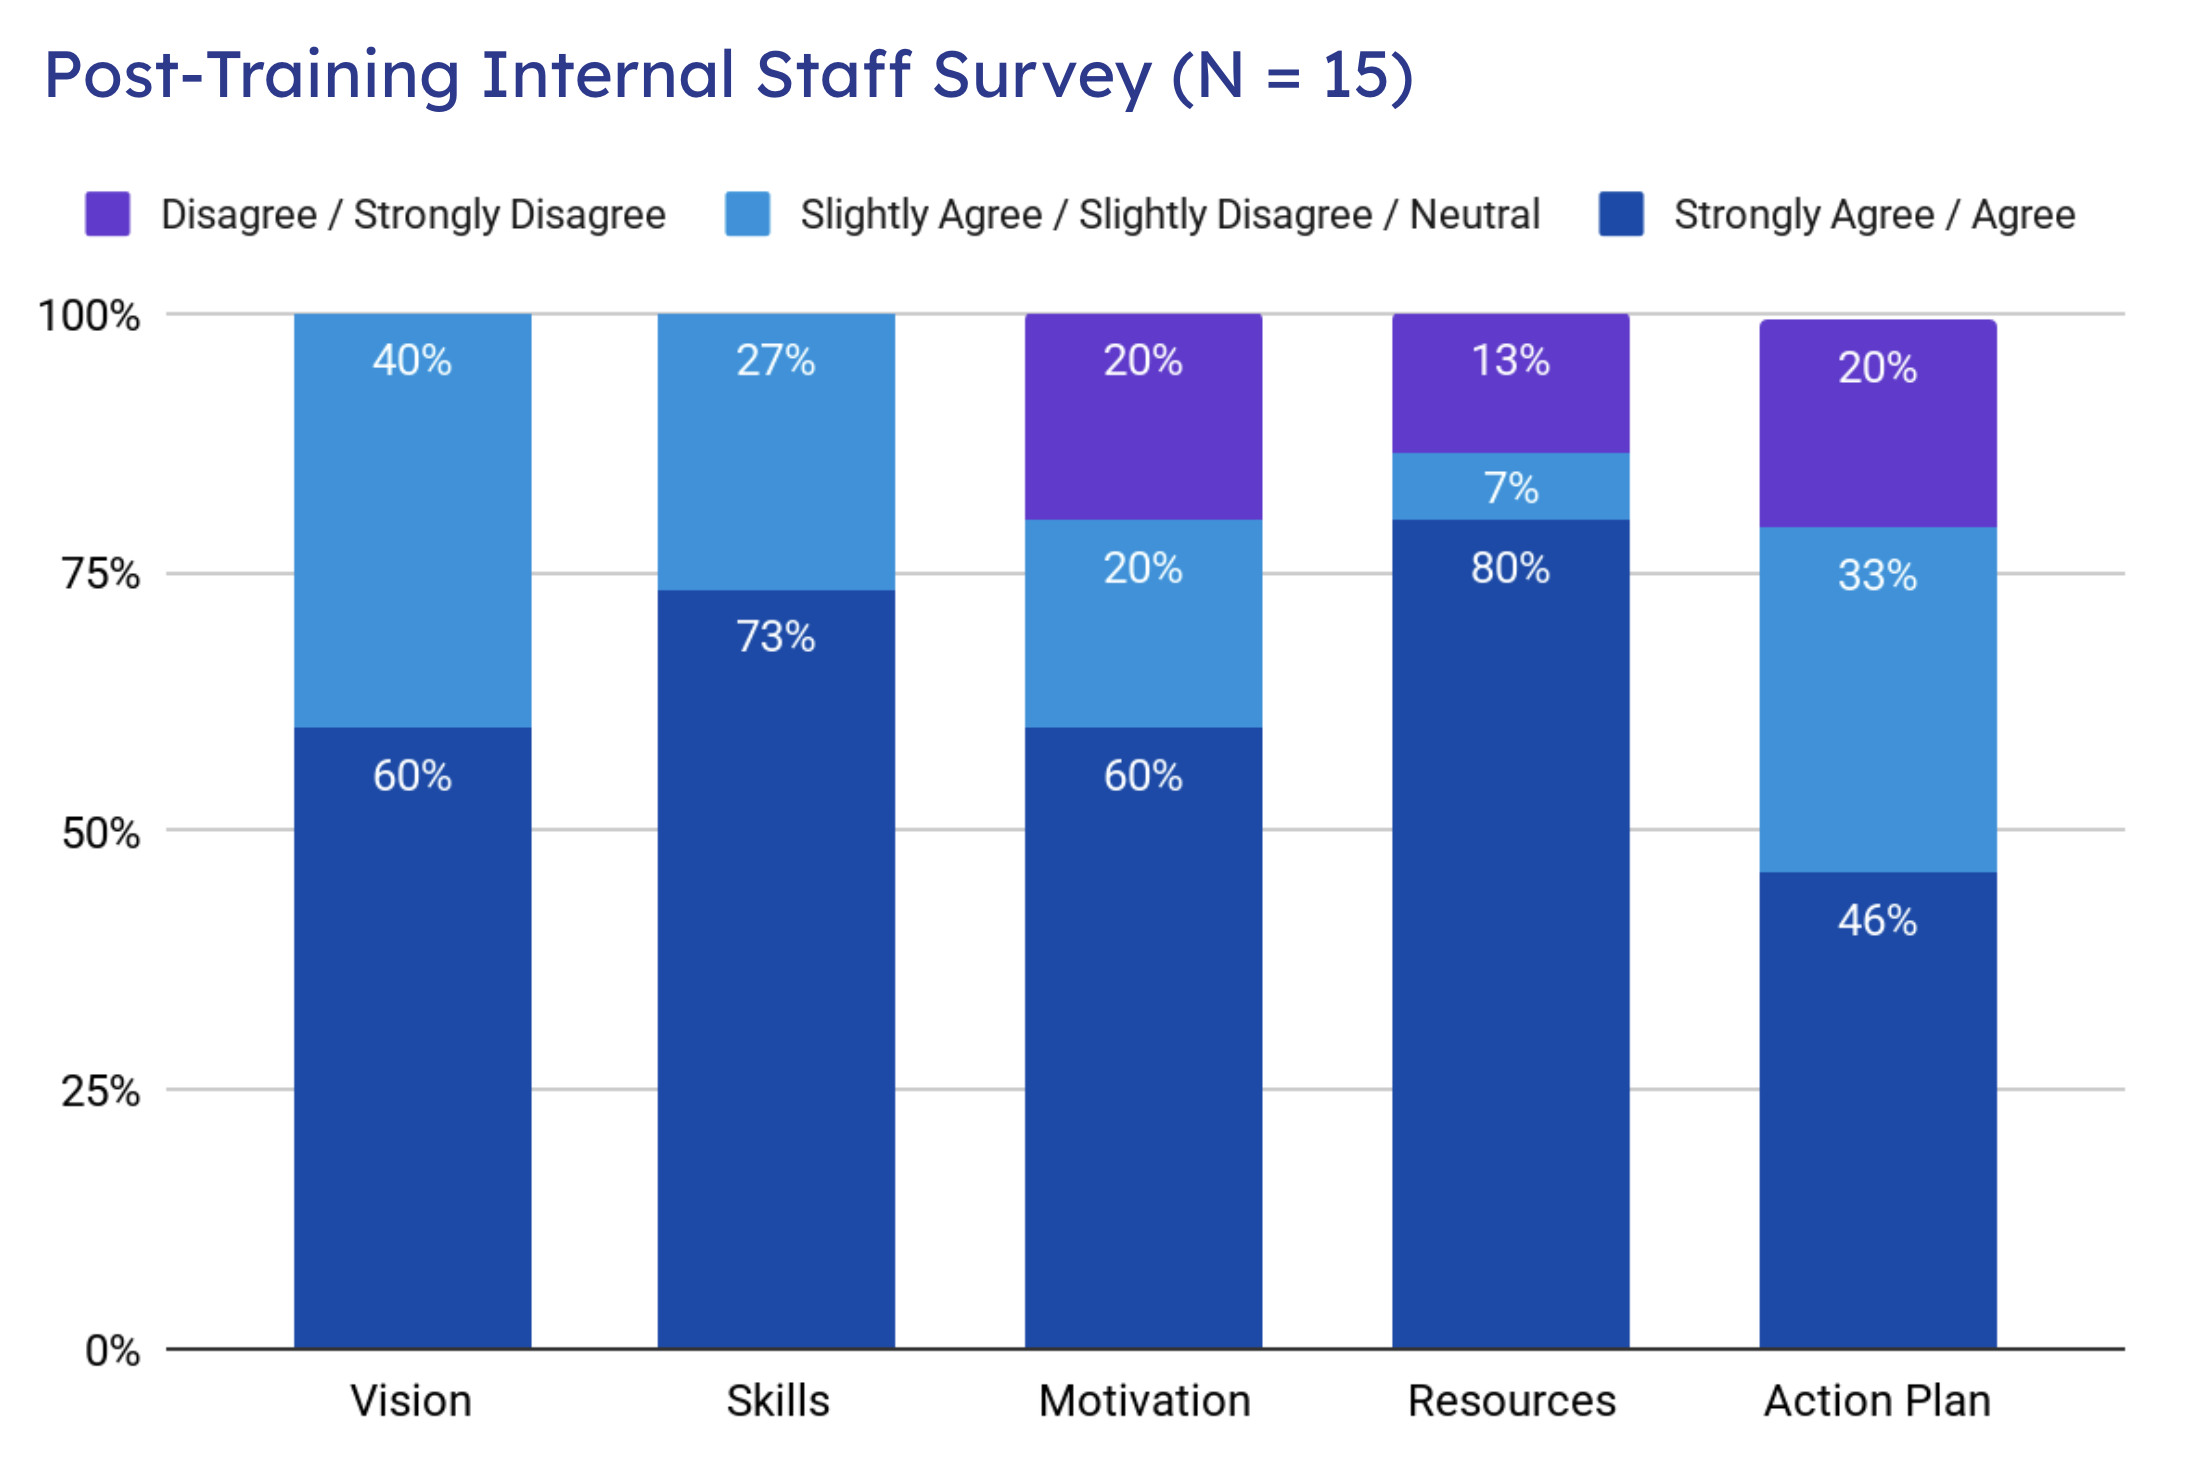
Post-Training Internal Staff Survey
Team members assessed their alignment across five key dimensions of change management: Vision, Skills, Motivation, Resources, and Action Plan.
Diagnostic Baseline: Areas of Strength
The post-training survey served as a critical diagnostic tool, establishing a baseline against which the district's growth can be measured over the next six months.
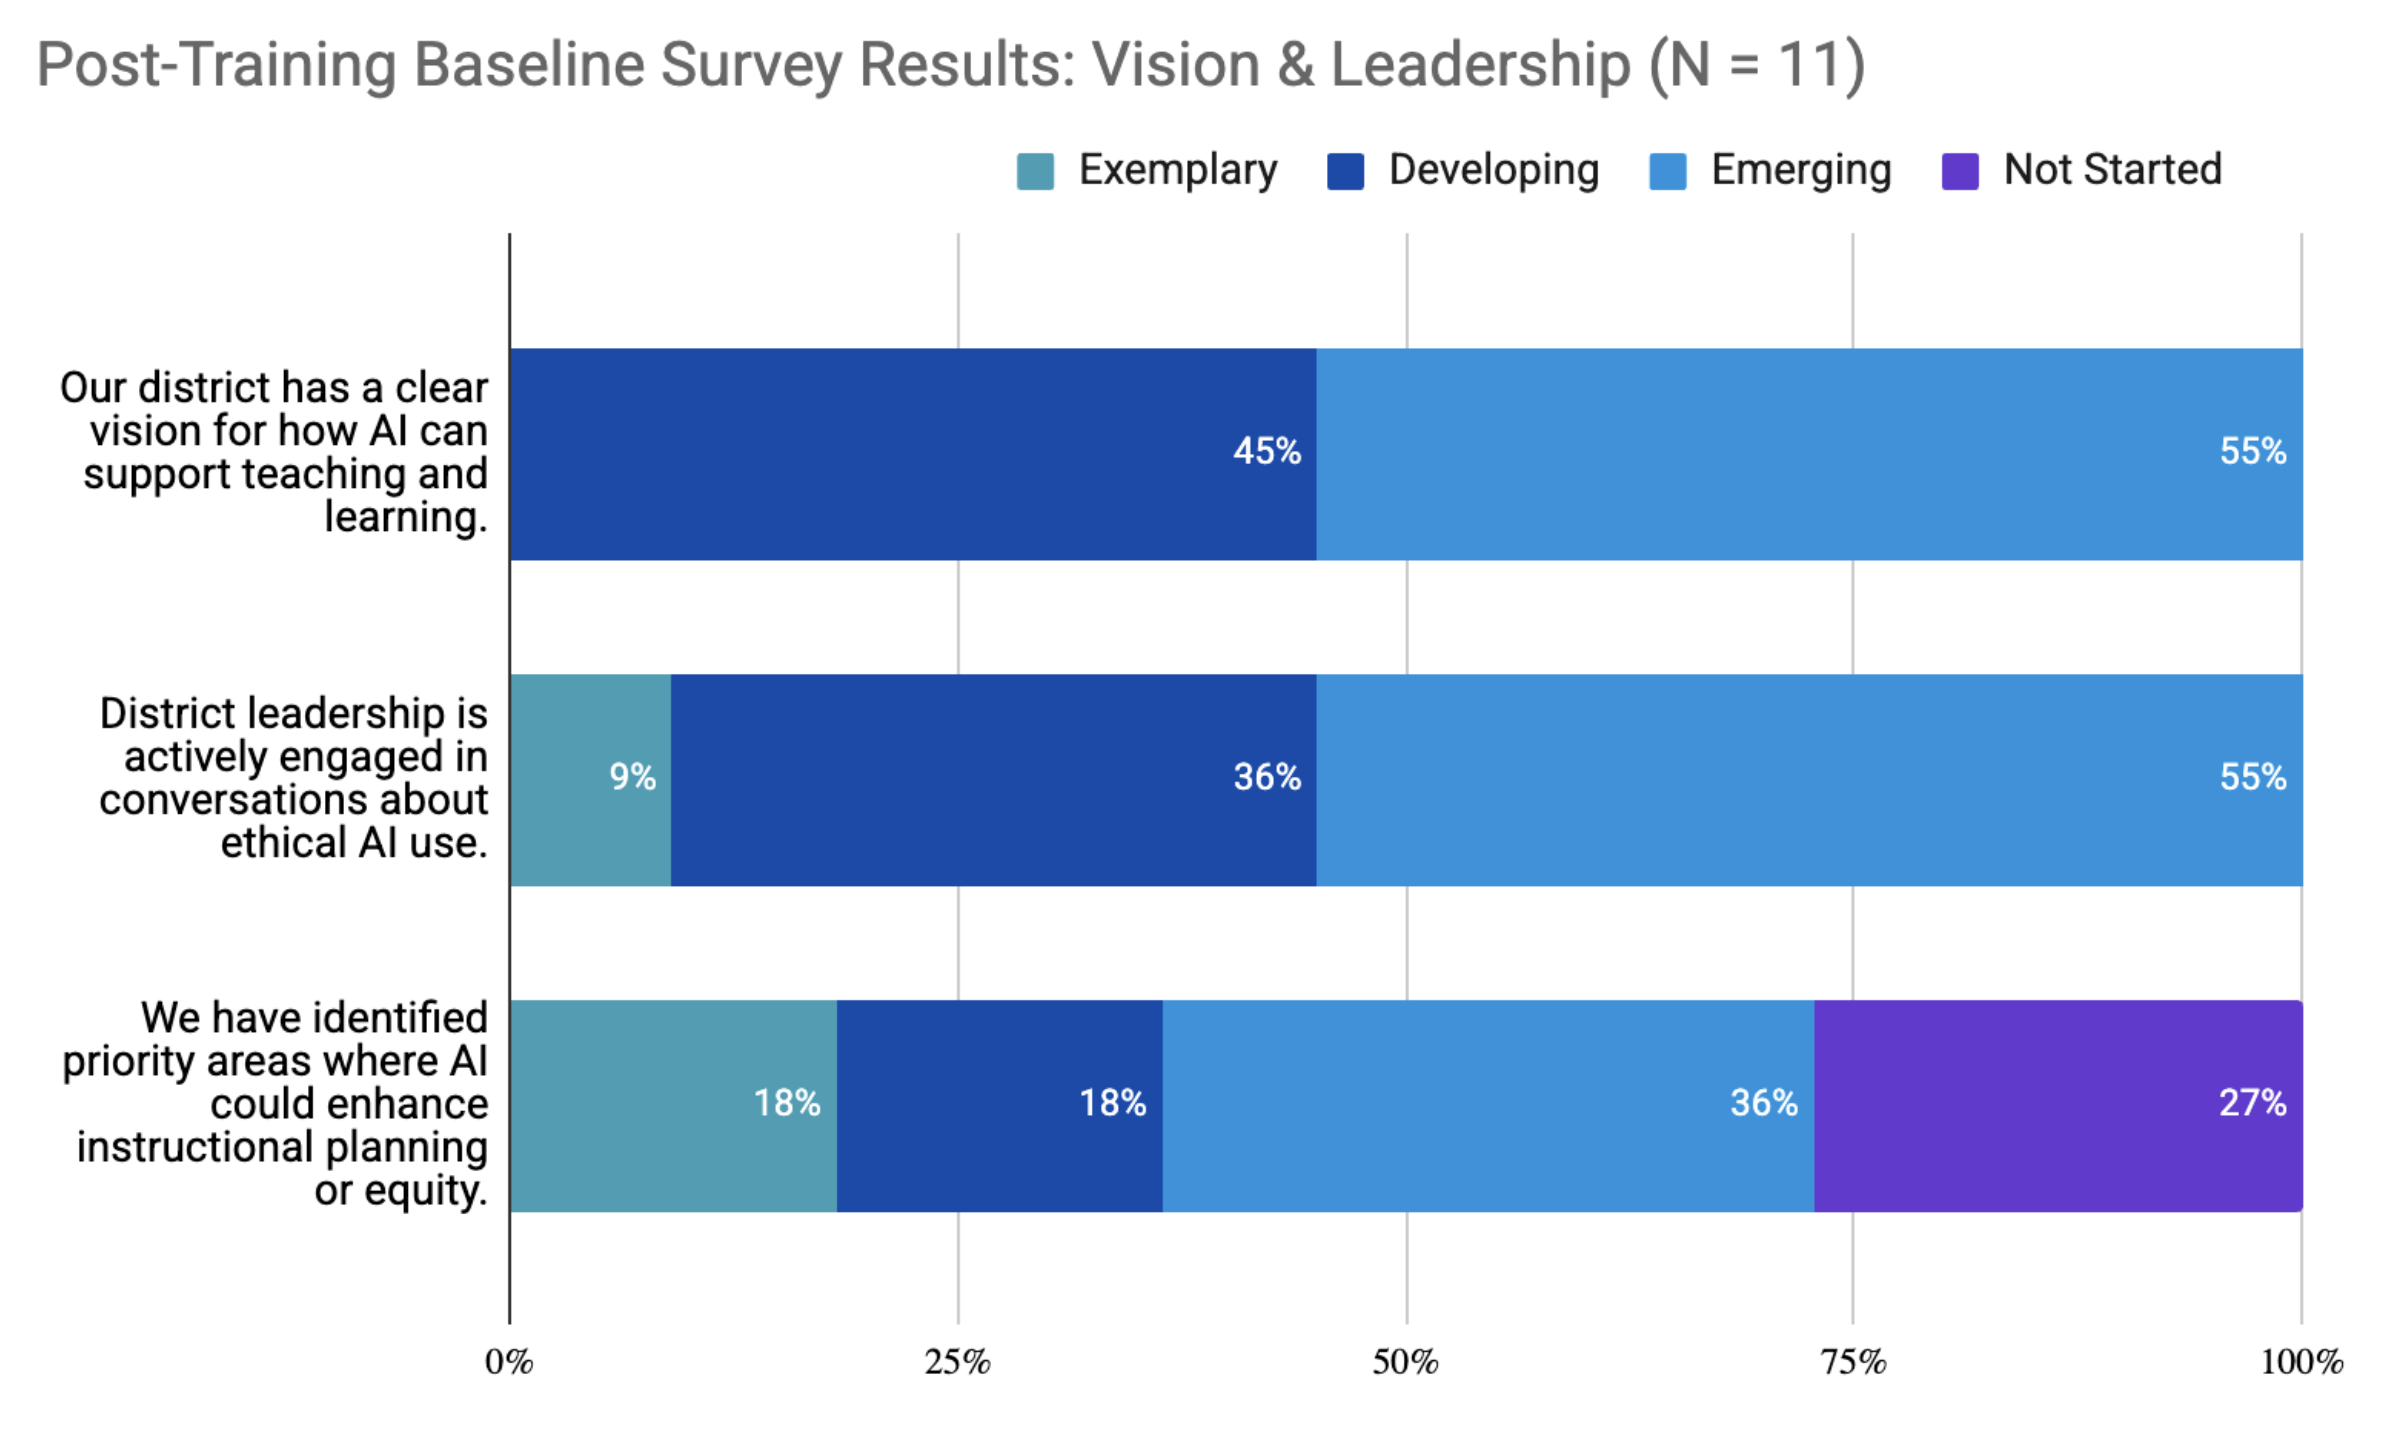
Vision & Leadership
A primary strength visible in the data is that 100% of executive leaders indicated they had established at minimum an emergent vision for AI. Achieving this shared vision was one of the core session objectives.
This strong initial collective agreement is a foundational indicator of success for AI organizational readiness. The goal for follow-up is to confirm that the District has moved beyond this initial “emerging” status into “developing” or “exemplary” levels of readiness.
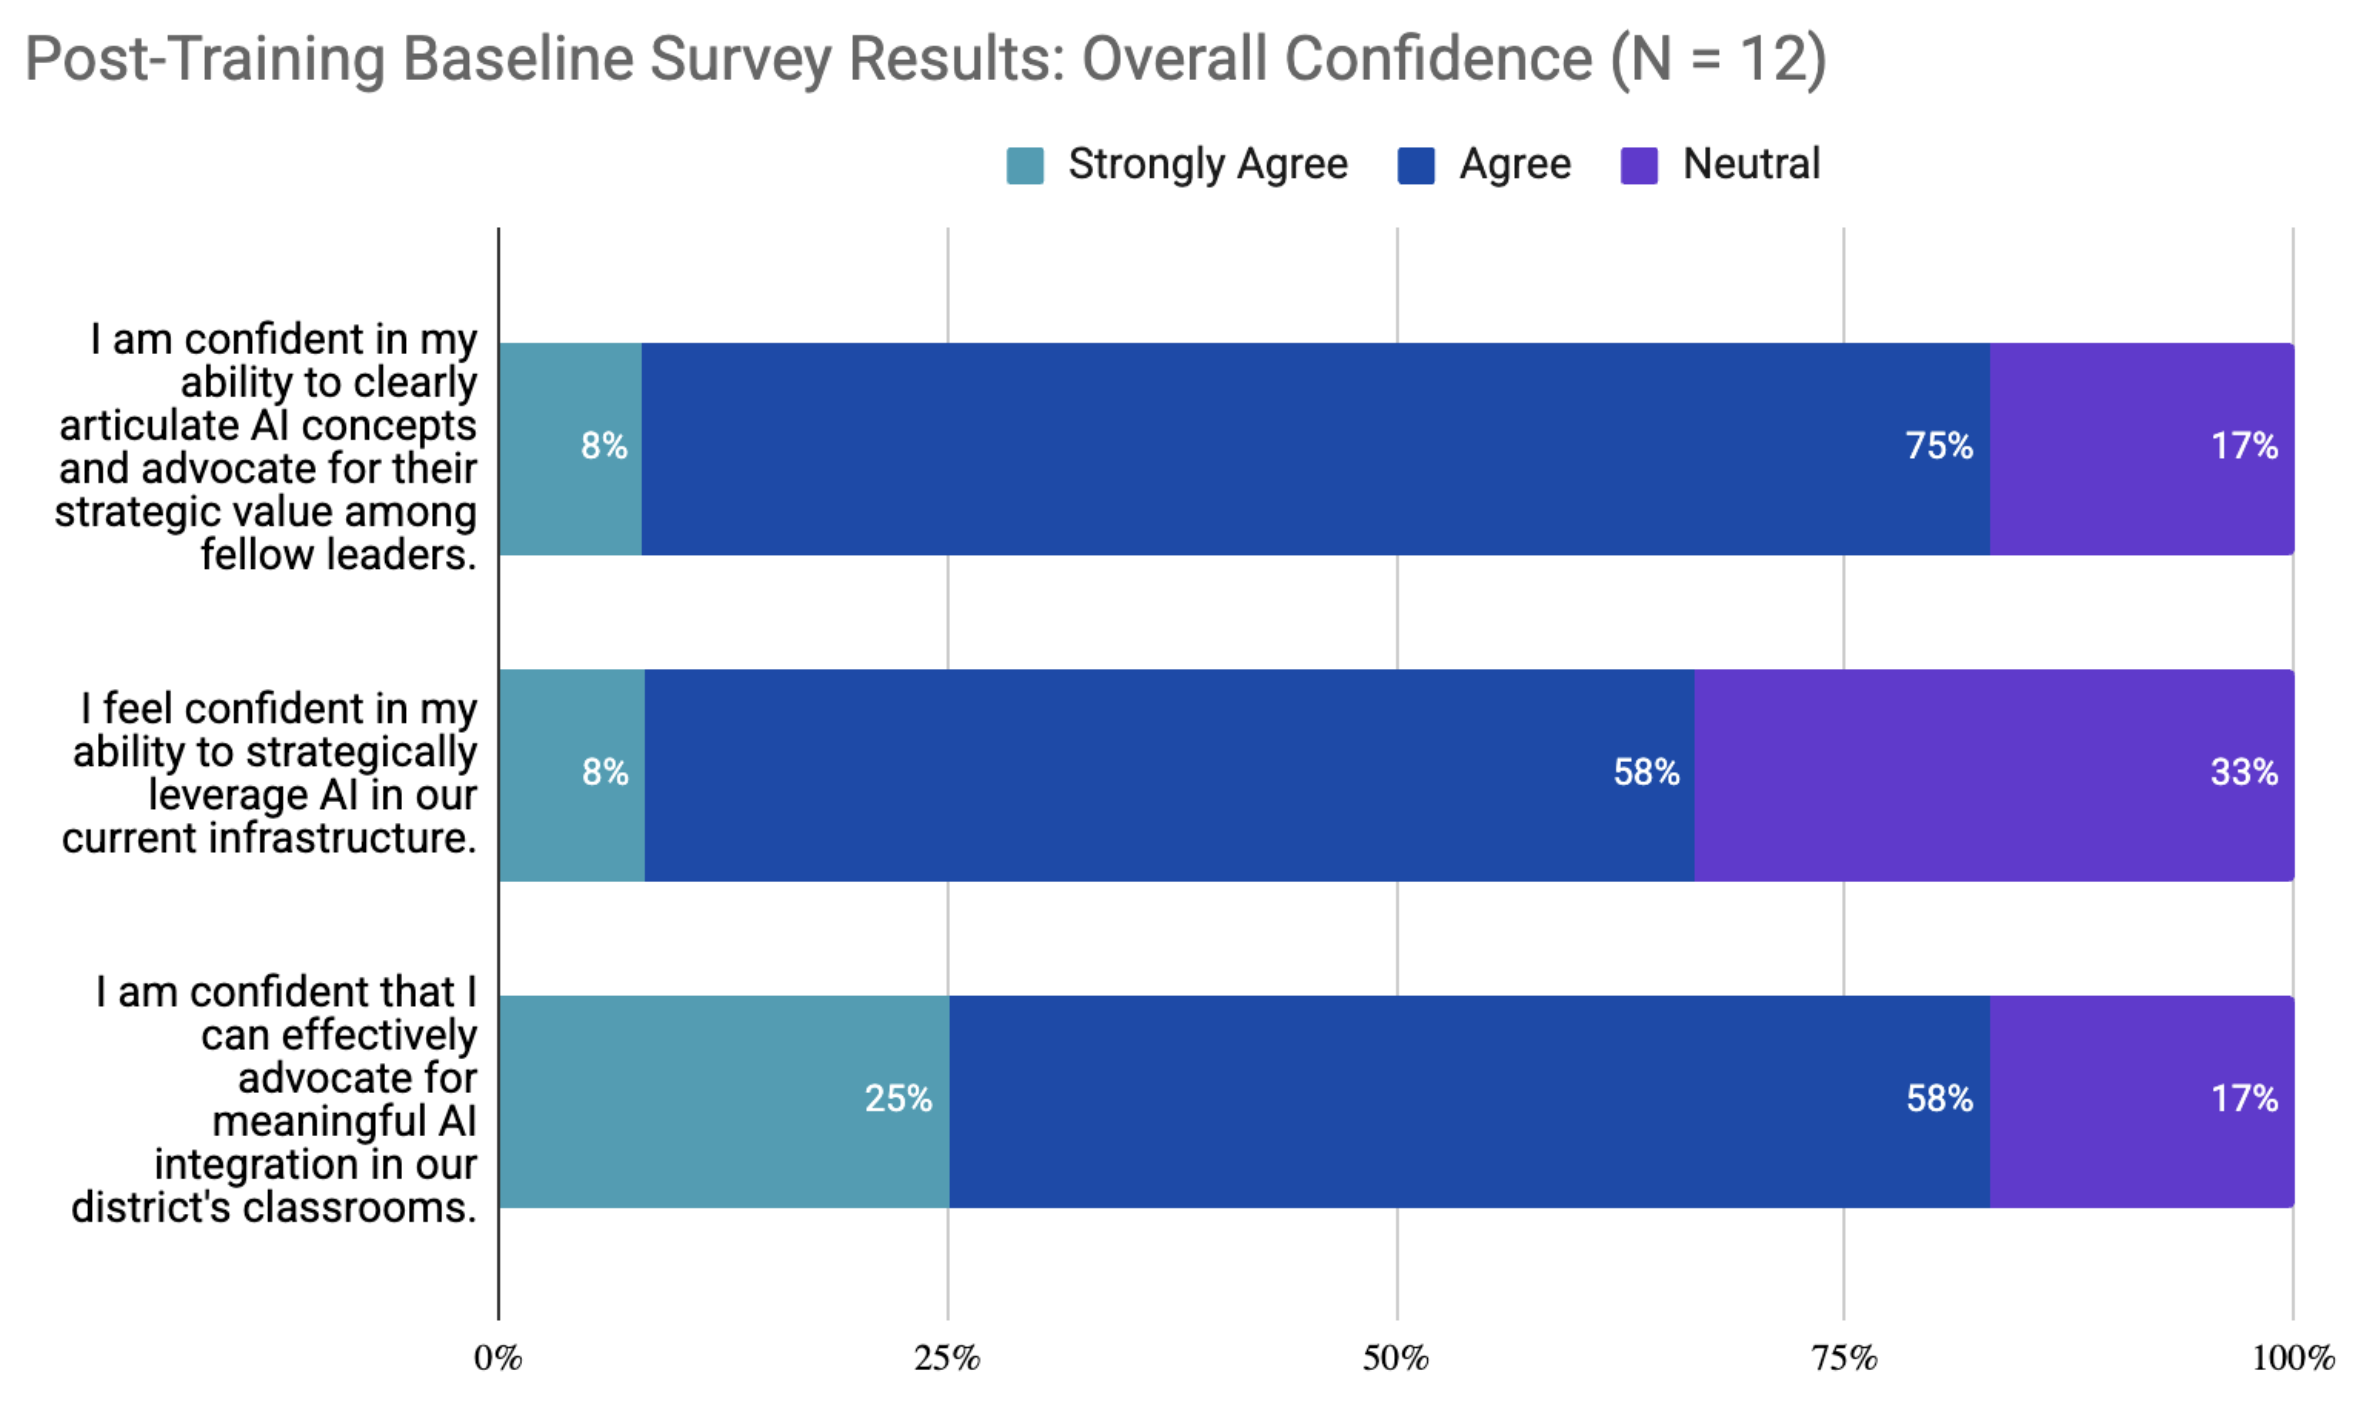
Overall Confidence
The survey also measured leaders' confidence in their ability to articulate AI concepts, strategically leverage AI in current infrastructure, and advocate for meaningful AI integration in classrooms.
Results show strong foundations with 83% expressing confidence in articulating AI concepts.
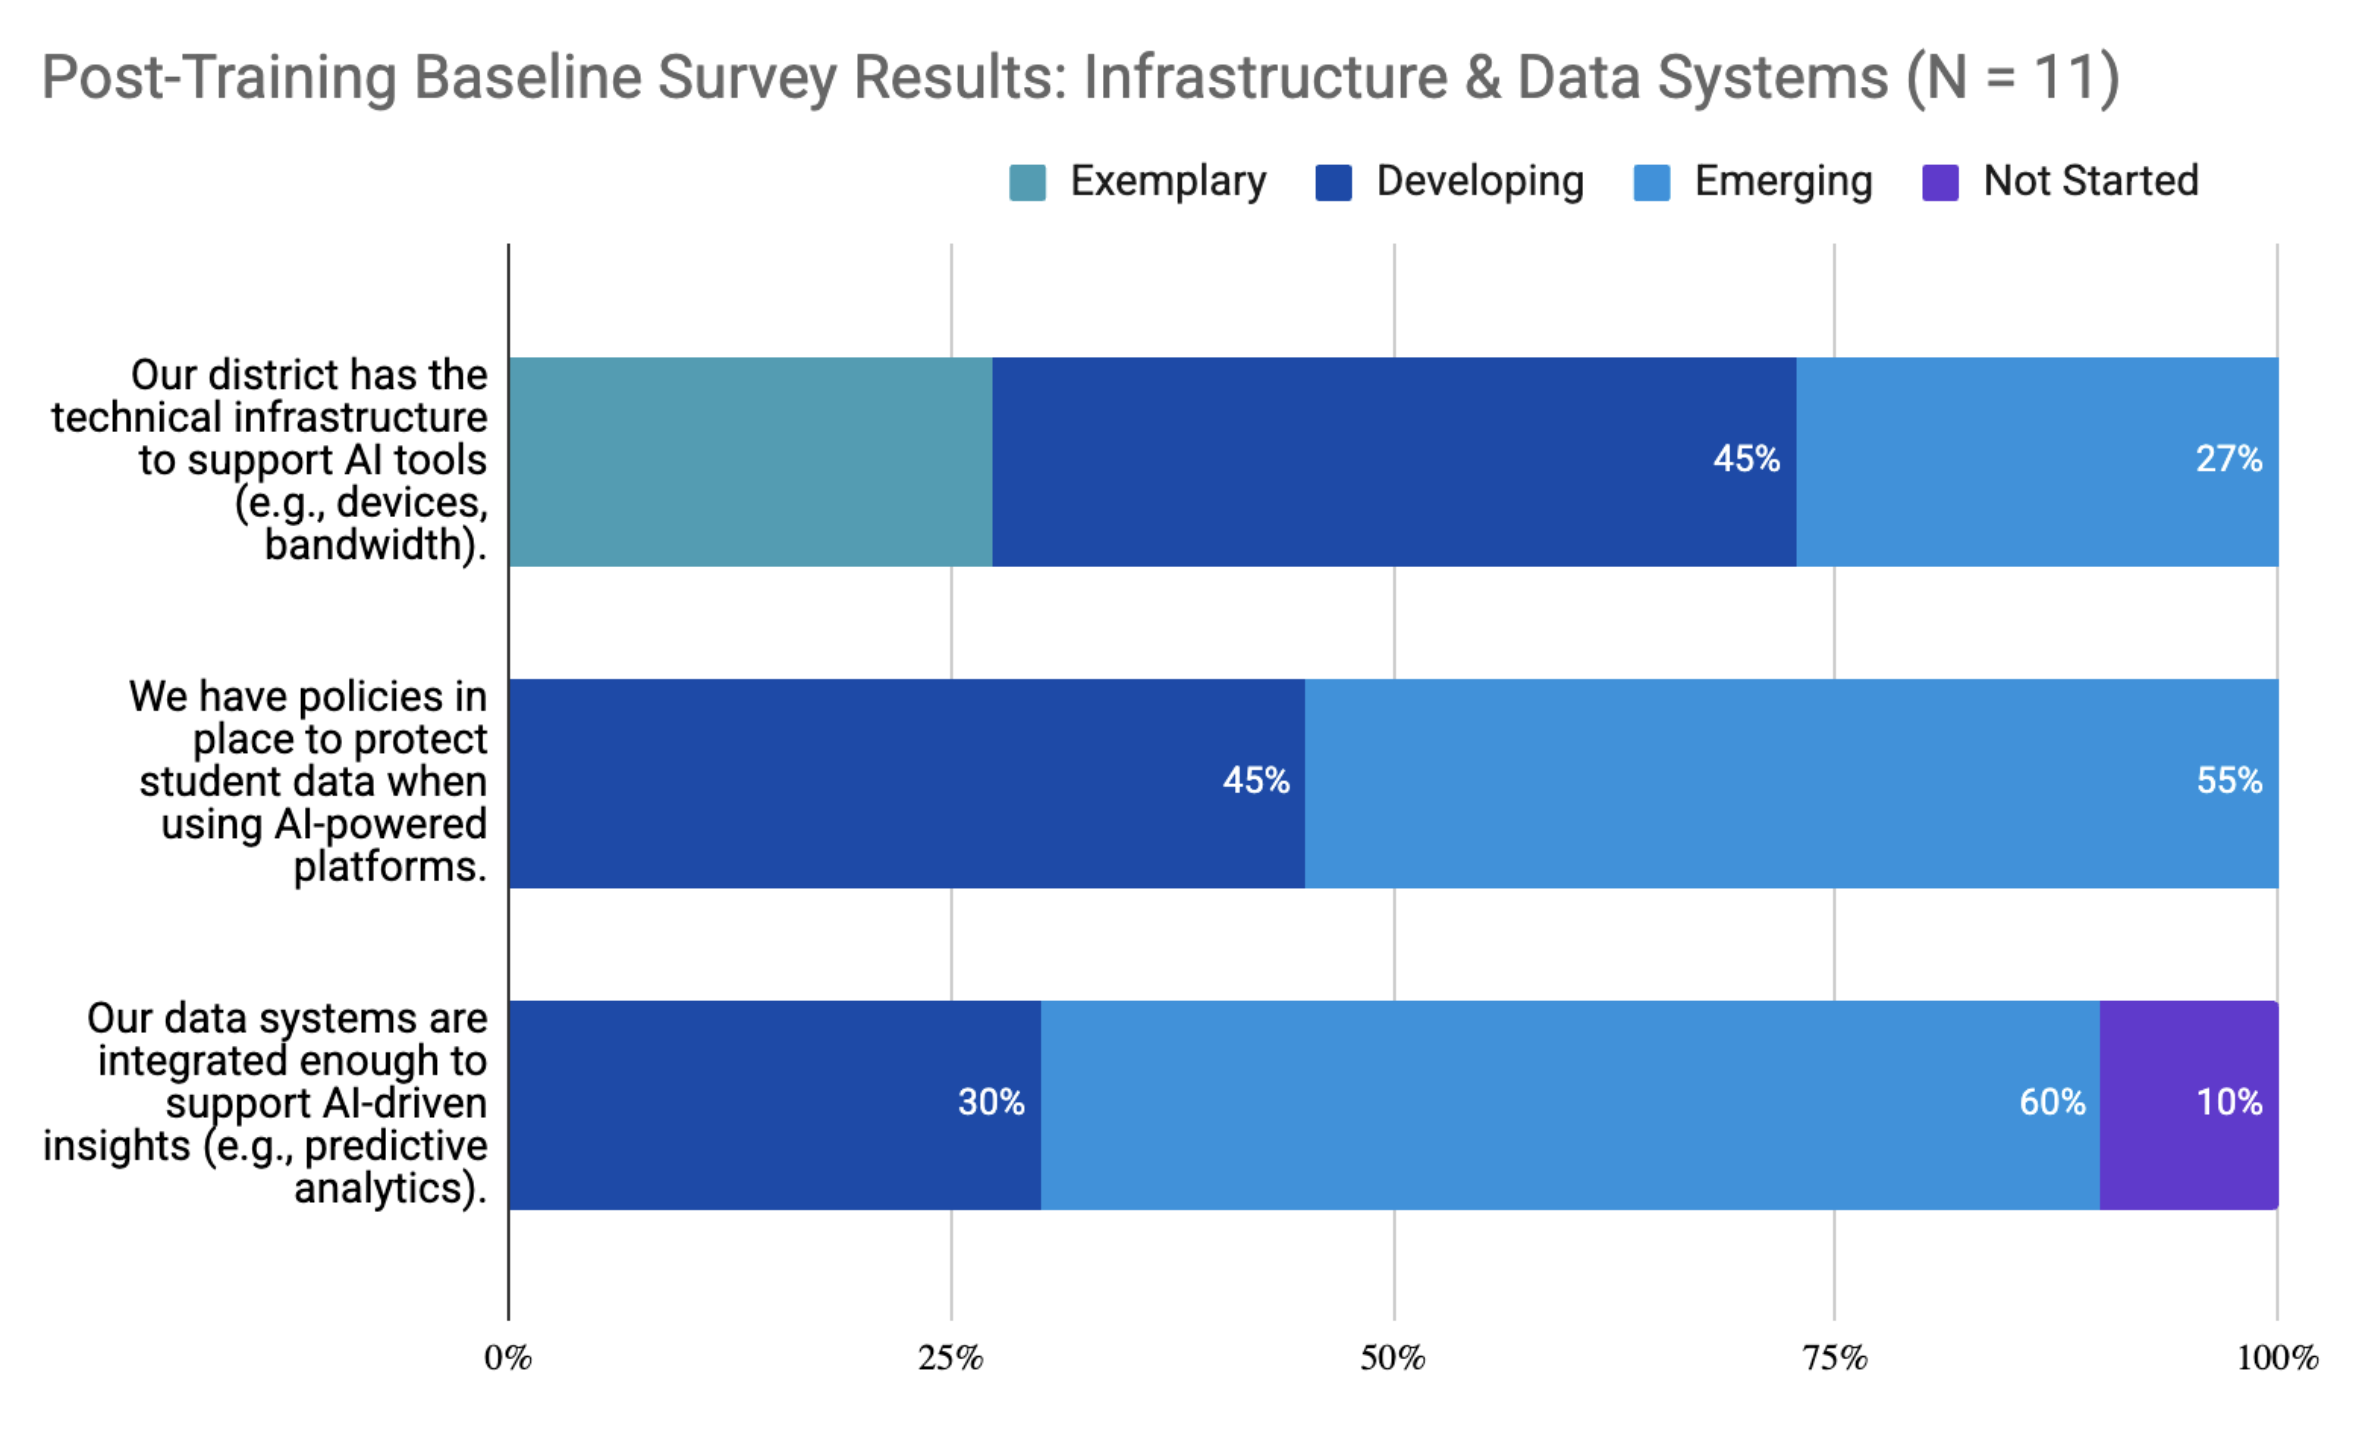
Infrastructure & Data Systems
100% of responding executive leaders indicated that the district’s AI policies are at least at an emergent stage.
One of the highest-rated items focused on the district’s technological infrastructure, with a quarter of respondents rating it as “exemplary.”
Diagnostic Baseline: Areas for Growth
The data revealed striking trends around community engagement and instructional integration, which represent the district's greatest areas needing immediate focus.
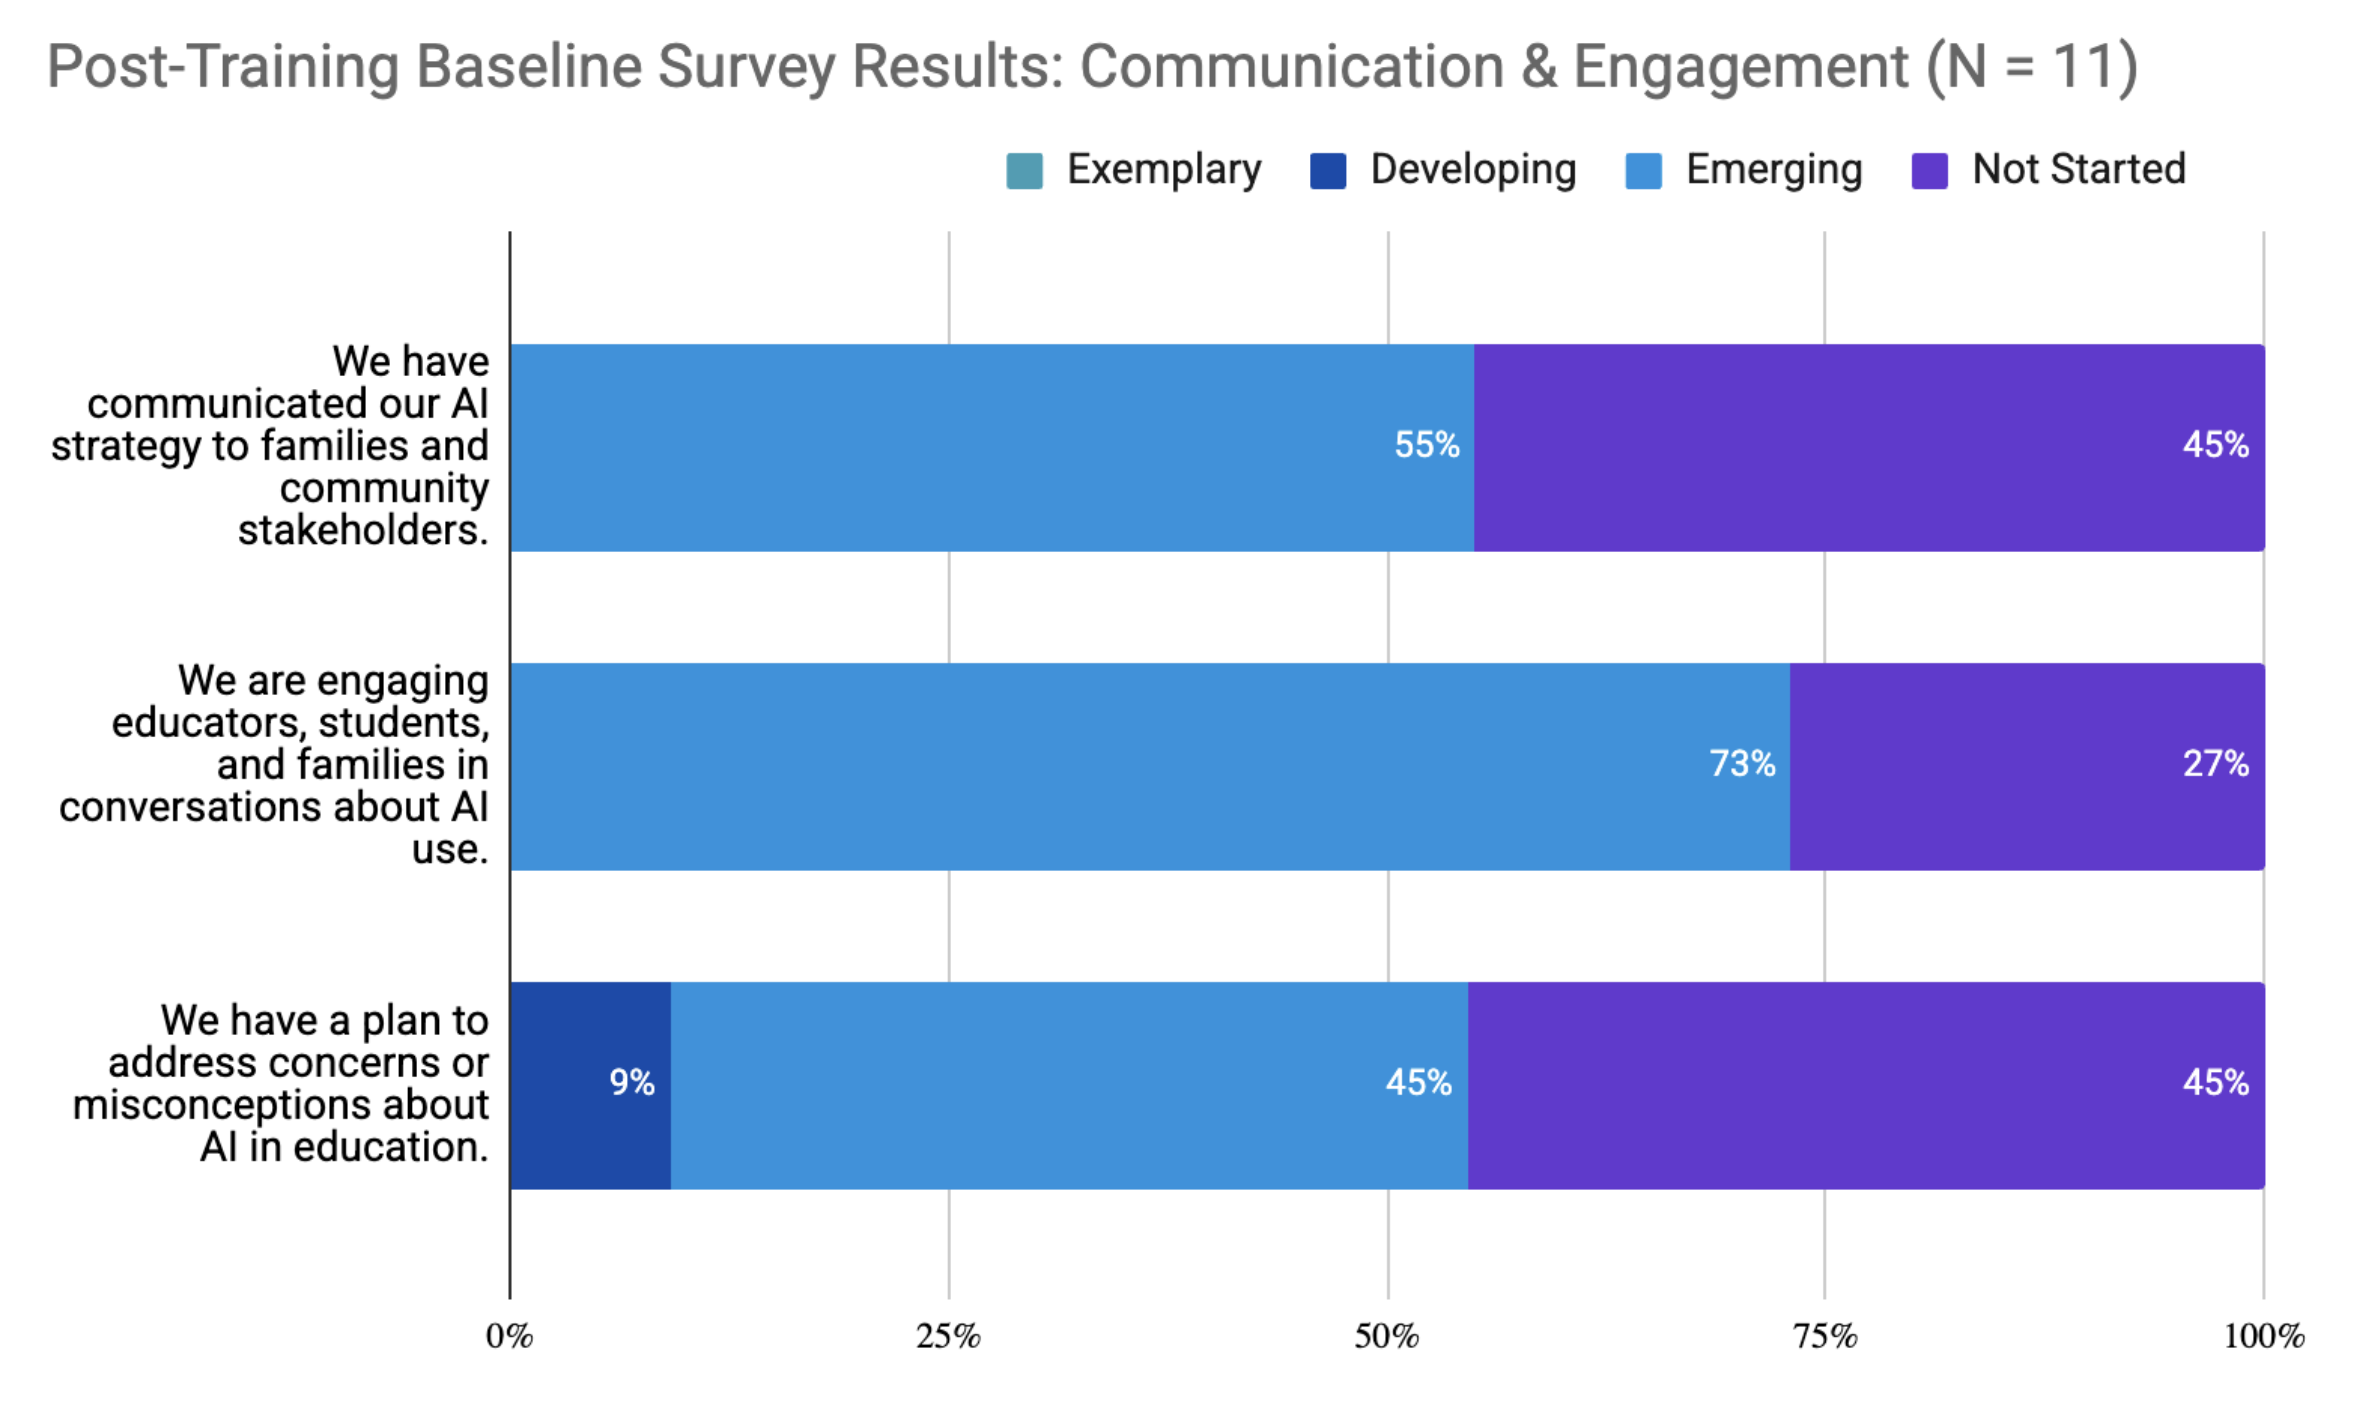
Communication & Engagement
A core objective of the session was to develop an initial communication plan, meaning external communication had just begun. The baseline results are informative:
- Nearly half of executives felt the district had not yet communicated their vision to the broader community
- One-third felt families had not been engaged at all in conversations about AI
Given that the communication plan heavily emphasized family engagement, we anticipate seeing significant positive traction after the six-month follow-up.
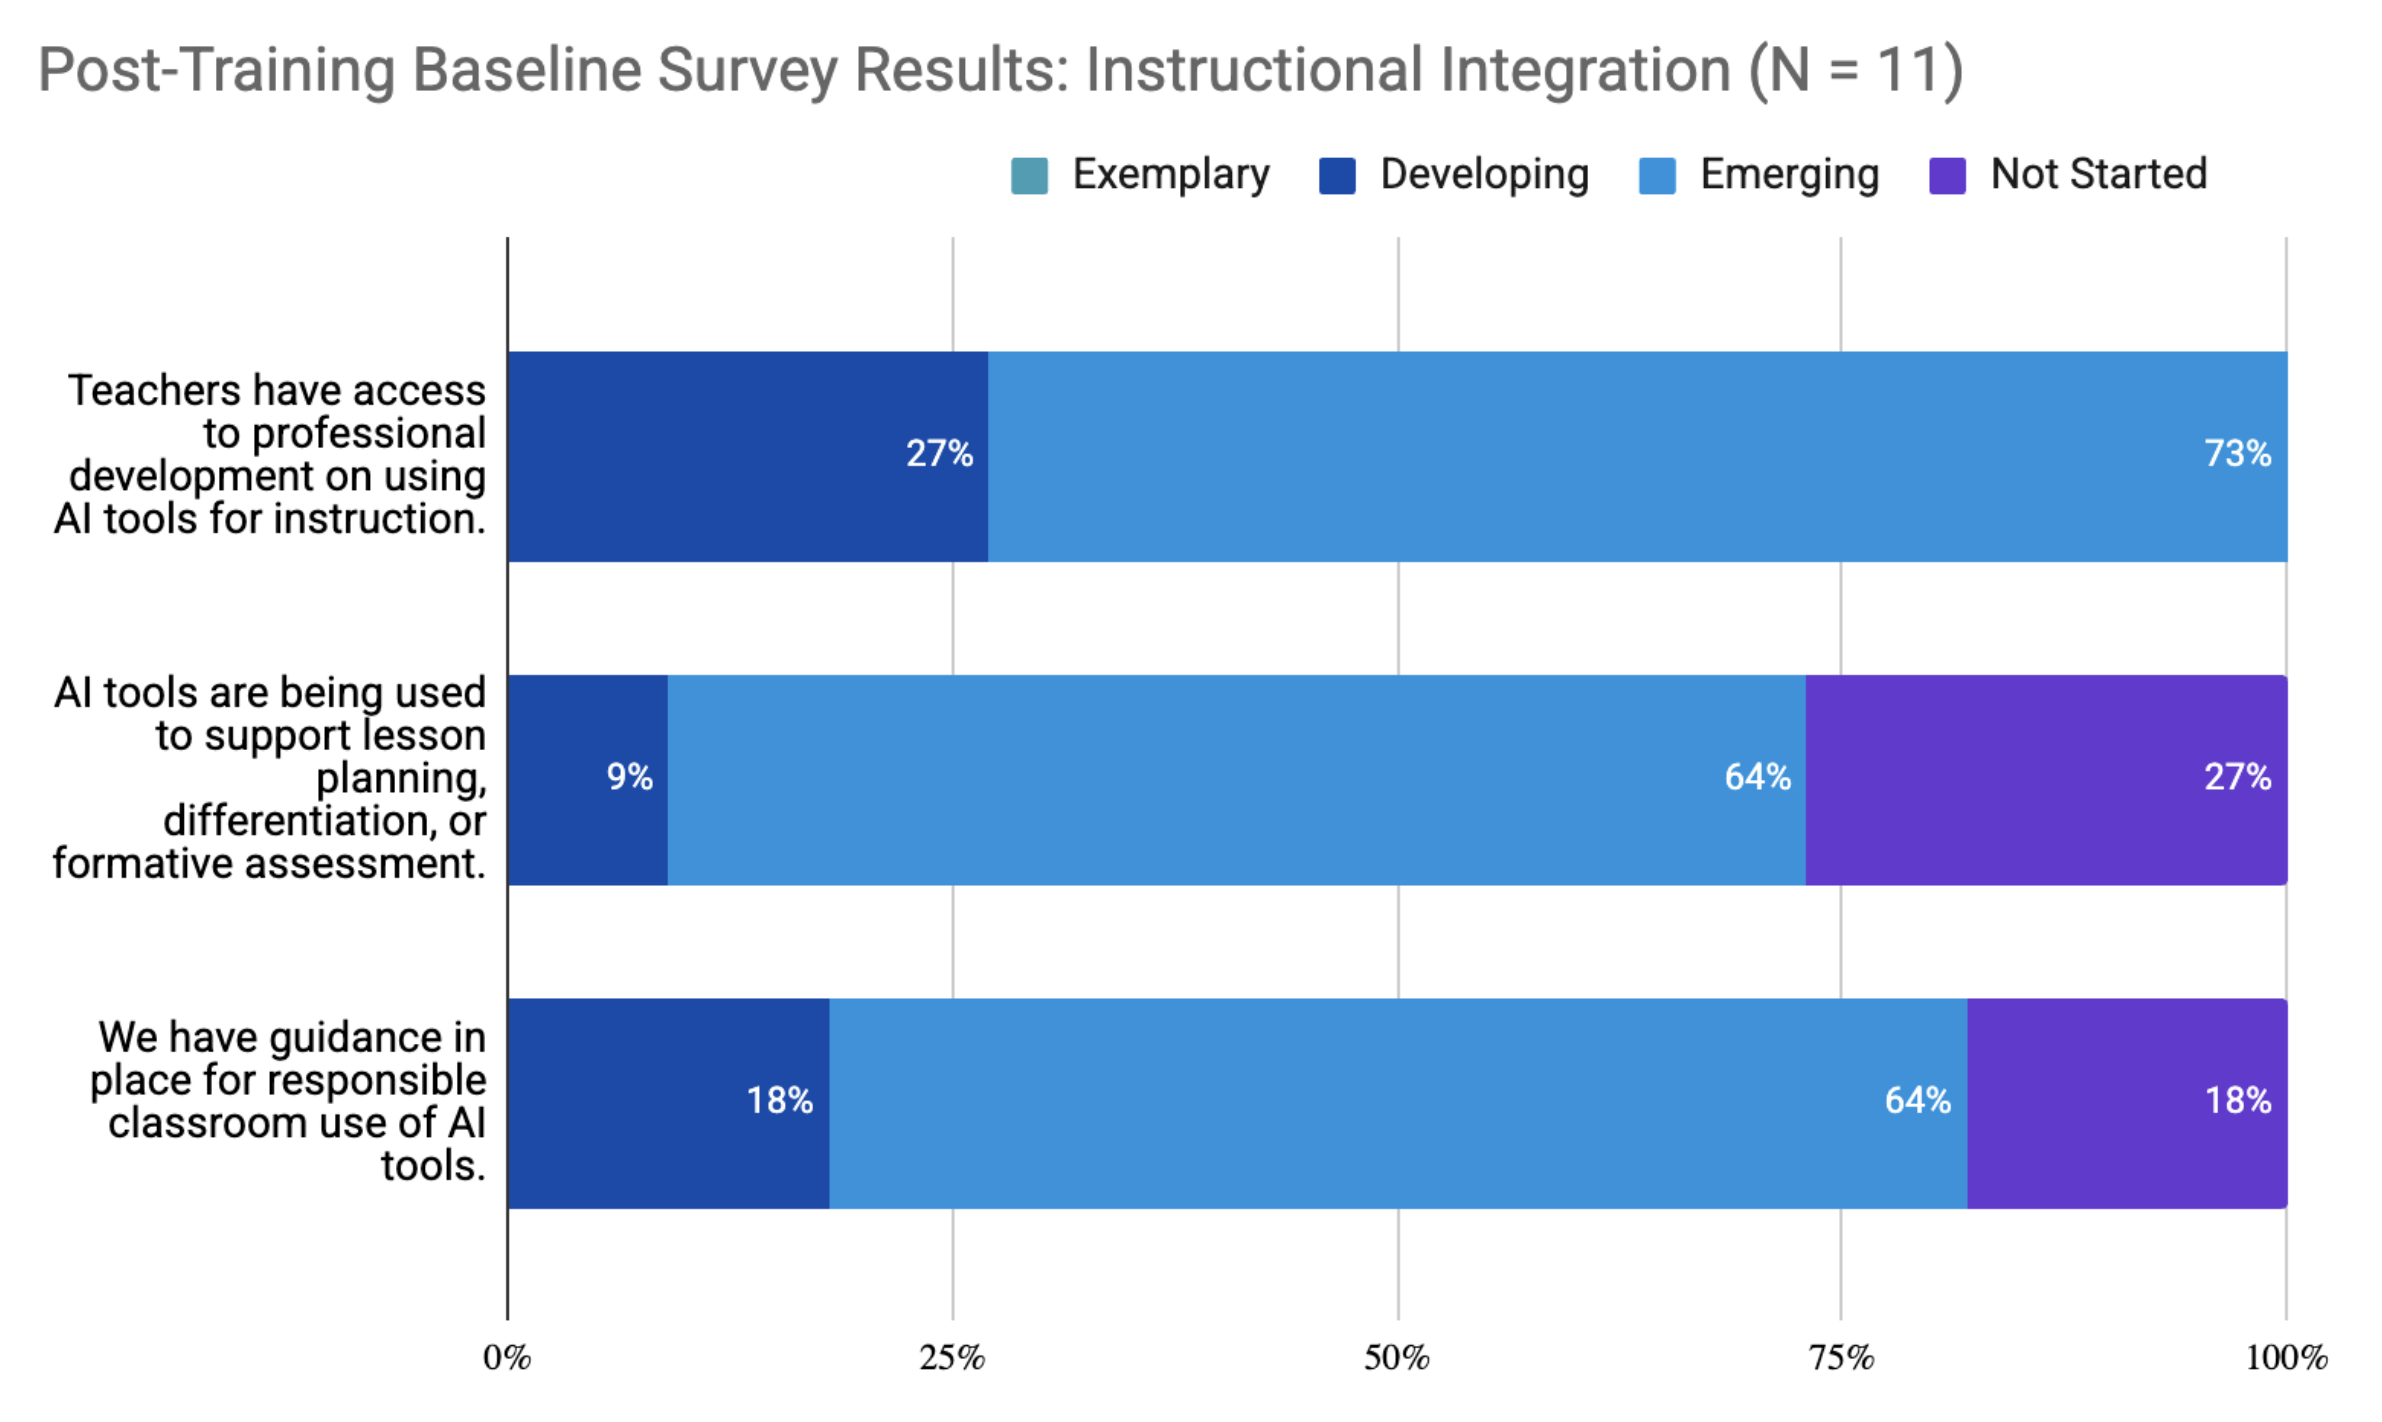
Instructional Integration
Professional development and classroom integration represent key areas for continued growth. While 100% of leaders report at least emerging access to PD, the instructional use of AI tools remains nascent.
Nearly one-fifth of respondents indicated that the district lacks sufficient guidance for responsible AI use in the classroom.
Looking Ahead
These results provide evidence that the project largely achieved the intended outcomes outlined in the logic model. The partnership is currently in talks with the district to continue and gather summative data, with the goal of confirming movement beyond the initial baseline into developing or exemplary levels of AI organizational readiness.